【CloudFormation】EKSの全てのNode、Podを自動でCloudWatchダッシュボードに追加する
本記事では、CloudFormationによる、EKS のメトリクスをCloudWatchダッシュボードに追加する方法について、コード付きで解説します。
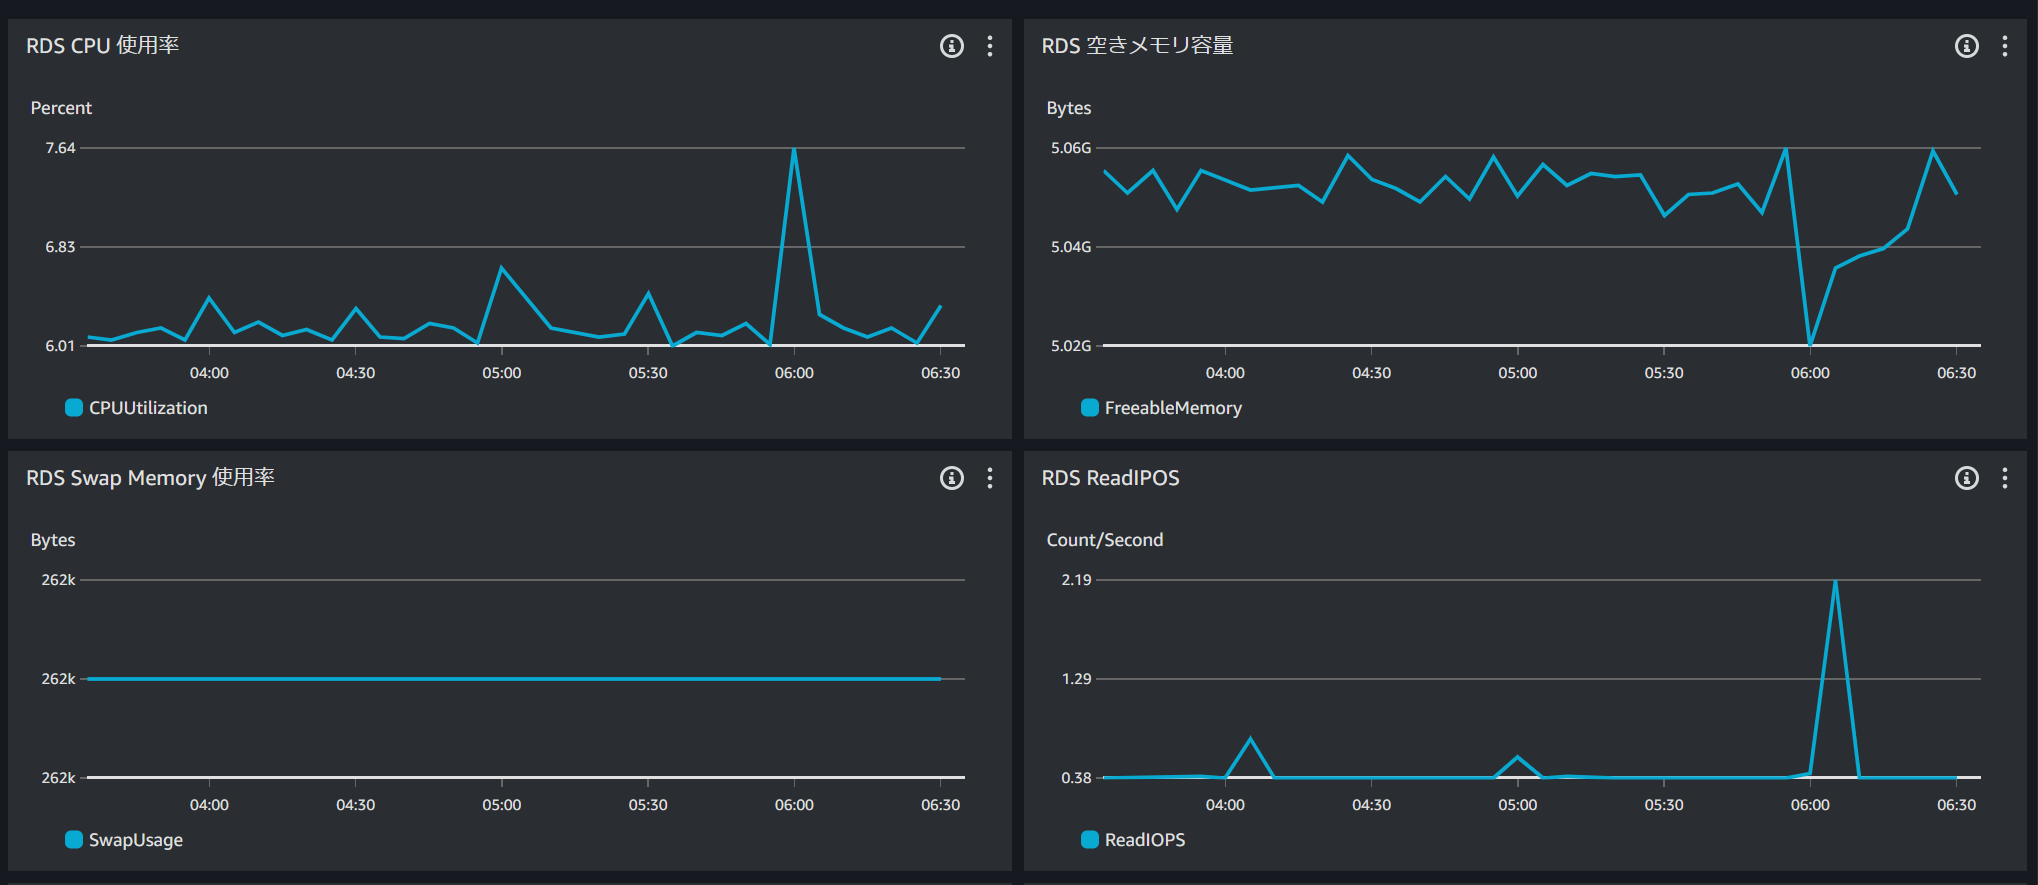
※下記写真は例です。
前提
EKS、Podは事前に作成する。
EKSの名前は下記。
・EKS:test-cluster
説明
検索式を使用することで、検索式に一致するメトリクスを自動的に追加するグラフを作成可能。
例えば、以下のような検索式を使用してグラフを表示することで、ClusterName=“test-cluster"のディメンションを持つnode_filesystem_utilizationメトリクスを表示させることが可能。
test-clusterにて新規にEC2インスタンスが起動した場合も、グラフも追従させることが可能。
SEARCH('{ContainerInsights,ClusterName} ClusterName="test-cluster" MetricName="node_filesystem_utilization"', 'Average', 60)
各サービスのmetrics、名前空間(namespace)は [2] のようなドキュメントから確認することが出来る。
[1] グラフで検索式を使用する
[2] Amazon EKS および Kubernetes Container Insights のメトリクス
実際のコード
AWSTemplateFormatVersion: '2010-09-09'

#####################################################################
#
# Parameters
#
#####################################################################
Parameters:
  EKSClusterName:
    Description: EKS Cluster Name
    Type: String
    Default: test-cluster

#####################################################################
#
# Dashboard
#
#####################################################################
Resources:
  CWDashboard:
    Type: AWS::CloudWatch::Dashboard
    Properties:
      DashboardName: !Sub '${AWS::StackName}'
      DashboardBody: !Sub |
        {
          "widgets": [

              {
                  "type": "metric",
                  "x": 0,
                  "y": 0,
                  "width": 12,
                  "height": 6,
                  "properties": {
                      "view": "timeSeries",
                      "stacked": false,
                      "metrics": [
                          [ "ContainerInsights", "cluster_failed_node_count", "ClusterName", "${EKSClusterName}" ]
                      ],
                      "region": "ap-northeast-1",
                      "title": "EKS cluster_failed_node_count"
                  }
              },
              {
                  "type": "metric",
                  "x": 12,
                  "y": 6,
                  "width": 12,
                  "height": 6,
                  "properties": {
                      "view": "timeSeries",
                      "stacked": false,
                      "metrics": [
                          [ "ContainerInsights", "cluster_node_count", "ClusterName", "${EKSClusterName}" ]
                      ],
                      "region": "ap-northeast-1",
                      "title": "EKS cluster_node_count"
                  }
              },
              {
                  "type": "metric",
                  "x": 0,
                  "y": 6,
                  "width": 12,
                  "height": 6,
                  "properties": {
                      "view": "timeSeries",
                      "stacked": false,
                      "metrics": [
                      [{"expression": "SEARCH('{ContainerInsights,ClusterName,NodeName,InstanceId} ClusterName=\"${EKSClusterName}\" MetricName=\"node_cpu_utilization\"', 'Average', 60)"}]
                      ],
                      "region": "ap-northeast-1",
                      "title": "EKS node_cpu_utilization"
                  }
              },
              {
                  "type": "metric",
                  "x": 12,
                  "y": 12,
                  "width": 12,
                  "height": 6,
                  "properties": {
                      "view": "timeSeries",
                      "stacked": false,
                      "metrics": [
                      [{"expression": "SEARCH('{ContainerInsights,ClusterName,NodeName,InstanceId} ClusterName=\"${EKSClusterName}\" MetricName=\"node_filesystem_utilization\"', 'Average', 60)"}]
                      ],
                      "region": "ap-northeast-1",
                      "title": "EKS node_filesystem_utilization"
                  }
              },
              {
                  "type": "metric",
                  "x": 0,
                  "y": 12,
                  "width": 12,
                  "height": 6,
                  "properties": {
                      "view": "timeSeries",
                      "stacked": false,
                      "metrics": [
                      [{"expression": "SEARCH('{ContainerInsights,ClusterName,NodeName,InstanceId} ClusterName=\"${EKSClusterName}\" MetricName=\"node_memory_utilization\"', 'Average', 60)"}]
                      ],
                      "region": "ap-northeast-1",
                      "title": "EKS node_memory_utilization"
                  }
              },
              {
                  "type": "metric",
                  "x": 12,
                  "y": 18,
                  "width": 12,
                  "height": 6,
                  "properties": {
                      "view": "timeSeries",
                      "stacked": false,
                      "metrics": [
                      [{"expression": "SEARCH('{ContainerInsights,ClusterName,NodeName,InstanceId} ClusterName=\"${EKSClusterName}\" MetricName=\"node_number_of_running_containers\"', 'Average', 60)"}]
                      ],
                      "region": "ap-northeast-1",
                      "title": "EKS node_number_of_running_containers"
                  }
              },
              {
                  "type": "metric",
                  "x": 0,
                  "y": 18,
                  "width": 12,
                  "height": 6,
                  "properties": {
                      "view": "timeSeries",
                      "stacked": false,
                      "metrics": [
                      [{"expression": "SEARCH('{ContainerInsights,ClusterName,NodeName,InstanceId} ClusterName=\"${EKSClusterName}\" MetricName=\"node_number_of_running_pods\"', 'Average', 60)"}]
                      ],
                      "region": "ap-northeast-1",
                      "title": "EKS node_number_of_running_pods"
                  }
              },
              {
                  "type": "metric",
                  "x": 12,
                  "y": 24,
                  "width": 12,
                  "height": 6,
                  "properties": {
                      "view": "timeSeries",
                      "stacked": false,
                      "metrics": [
                      [{"expression": "SEARCH('{ContainerInsights,PodName,Namespace,ClusterName} ClusterName=\"${EKSClusterName}\" MetricName=\"pod_cpu_utilization\"', 'Average', 60)"}]
                      ],
                      "region": "ap-northeast-1",
                      "title": "EKS pod_cpu_utilization"
                  }
              },
              {
                  "type": "metric",
                  "x": 0,
                  "y": 24,
                  "width": 12,
                  "height": 6,
                  "properties": {
                      "view": "timeSeries",
                      "stacked": false,
                      "metrics": [
                      [{"expression": "SEARCH('{ContainerInsights,PodName,Namespace,ClusterName} ClusterName=\"${EKSClusterName}\" MetricName=\"pod_cpu_utilization_over_pod_limit\"', 'Average', 60)"}]
                      ],
                      "region": "ap-northeast-1",
                      "title": "EKS pod_cpu_utilization_over_pod_limit"
                  }
              },
              {
                  "type": "metric",
                  "x": 12,
                  "y": 30,
                  "width": 12,
                  "height": 6,
                  "properties": {
                      "view": "timeSeries",
                      "stacked": false,
                      "metrics": [
                      [{"expression": "SEARCH('{ContainerInsights,PodName,Namespace,ClusterName} ClusterName=\"${EKSClusterName}\" MetricName=\"pod_memory_utilization\"', 'Average', 60)"}]
                      ],
                      "region": "ap-northeast-1",
                      "title": "EKS pod_memory_utilization"
                  }
              },
              {
                  "type": "metric",
                  "x": 0,
                  "y": 30,
                  "width": 12,
                  "height": 6,
                  "properties": {
                      "view": "timeSeries",
                      "stacked": false,
                      "metrics": [
                      [{"expression": "SEARCH('{ContainerInsights,PodName,Namespace,ClusterName} ClusterName=\"${EKSClusterName}\" MetricName=\"pod_memory_utilization_over_pod_limit\"', 'Average', 60)"}]
                      ],
                      "region": "ap-northeast-1",
                      "title": "EKS pod_memory_utilization_over_pod_limit"
                  }
              },
              {
                  "type": "metric",
                  "x": 12,
                  "y": 36,
                  "width": 12,
                  "height": 6,
                  "properties": {
                      "view": "timeSeries",
                      "stacked": false,
                      "metrics": [
                      [{"expression": "SEARCH('{ContainerInsights,PodName,Namespace,ClusterName} ClusterName=\"${EKSClusterName}\" MetricName=\"pod_number_of_container_restarts\"', 'Average', 60)"}]
                      ],
                      "region": "ap-northeast-1",
                      "title": "EKS pod_number_of_container_restarts"
                  }
              }
          ]
        }